CASE STUDIES · THE PROOF

Case Studies, With the Numbers.

Real client work. Names anonymized, depth untouched. Some figures are what we found in the books; others are what changed while we did the work.

Methodology: client names and identifying details are anonymized. Financial figures come from the underlying client books, operating dashboards or diligence work shown in each case study; periods and context are stated on the individual pages. Meet the people behind the work.

THE LEDGER · RESULTS TO DATE

Architecture PracticeYTD revenue growth42%
Financial Due DiligenceOverstatement caught pre-deal$120K
Real Estate HoldingsSwing to profitability$186K
New Amazon SellerRevenue from a standing start$17K
Tool Category BrandYoY revenue growth13%


FINANCE PORTFOLIO

What We've Built on the Finance Side.

Architectural plans being drawn by hand

Architecture Firm · Monthly + YTD

Operating Dashboard, Multi-Office Practice

  • 42%YTD revenue growth
  • 18team members tracked
  • 6dashboard panels built

A full operating dashboard: P&L expense breakout, balance-sheet comparison, AR aging, and per-person team efficiency, with AI insights built in.

  • P&L Analysis
  • Balance Sheet
  • Team Efficiency
View the dashboard
A reviewer marking up financial statements during diligence

Financial Due Diligence · FY 2025

Caught a $120K EBITDA Overstatement

  • $2.07Mrevenue reviewed
  • $120Koverstatement found
  • Highrisk rating assigned

A full due-diligence report that caught a material EBITDA overstatement before it reached the deal table: revenue concentration, AR risk, contract expiry, and a red-flags panel.

  • Due Diligence
  • Risk Assessment
  • Red Flags
View the dashboard
Office towers seen from street level

Real Estate Holdings · FY 2024

A +$186K Swing to Profitability

  • $1.03Mtotal revenue
  • +$186Kswing to profit
  • 5dashboard panels

A full-year dashboard, honest about negative equity and what drives it, with AI commentary explaining the why behind every number, not just the what.

  • Real Estate
  • P&L Analysis
  • Balance Sheet
View the dashboard

AMAZON PORTFOLIO

What We've Built for Amazon Brands.

A warehouse aisle stocked with inventory

Home & Wellness · $20M Brand

Replenishment Rebuilt, ERP Integrated

  • $20M+category value
  • ERPsystems integrated
  • Fullreplenishment rebuilt

Full supply-chain overhaul for a $20M aggregator-owned brand: we rebuilt replenishment across the catalog and integrated the ERP systems.

  • Supply Chain
  • ERP Integration
  • Inventory Automation
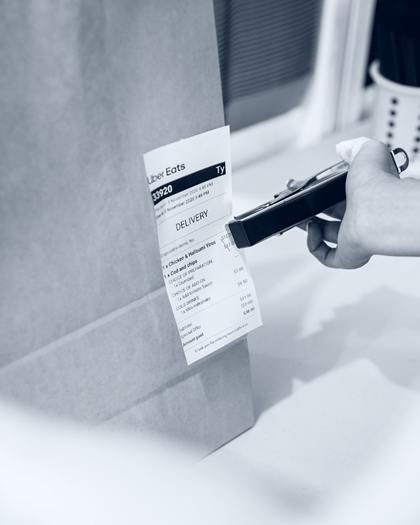
A parcel's shipping label being scanned

New Seller · 0 to Revenue

Zero to $17K in 3 Months

  • $17Krevenue generated
  • 3 mofrom zero to sales
  • TMtrademark filed

Took a brand-new Amazon seller from zero to $17K revenue within 3 months: listing creation, keyword research, A+ content, white-label strategy, trademark filing, and ongoing PPC.

  • Amazon PPC
  • Listing SEO
  • White Label
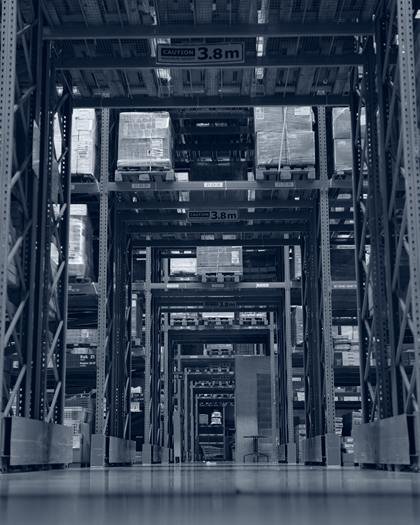
Tall warehouse racking for an e-commerce brand

Tool Category Brand · YoY

13% Revenue Growth, Better Margins

  • 13%YoY revenue growth
  • +3%net profit
  • Fullaccount management

Full account management combining supply chain, PPC, and financial oversight: 13% year-over-year revenue growth and a 3% net-profit improvement through better inventory and ad efficiency.

  • Full Account Mgmt
  • PPC
  • Supply Chain

The Next Move Is Yours

Start With a Complimentary Finance Review.

Start with a complimentary finance review and see exactly what is possible.

Request Your Finance Review →